One of Cloudflare’s big focus areas is making the Internet faster for end users. Part of the way we do that is by looking at the “big rocks” or bottlenecks that might be slowing things down — particularly processes on the critical path. When we recently turned our attention to our privacy proxy product, we found a big opportunity for improvement.
What is our privacy proxy product? These proxies let users browse the web without exposing their personal information to the websites they’re visiting. Cloudflare runs infrastructure for privacy proxies like Apple’s Private Relay and Microsoft’s Edge Secure Network.
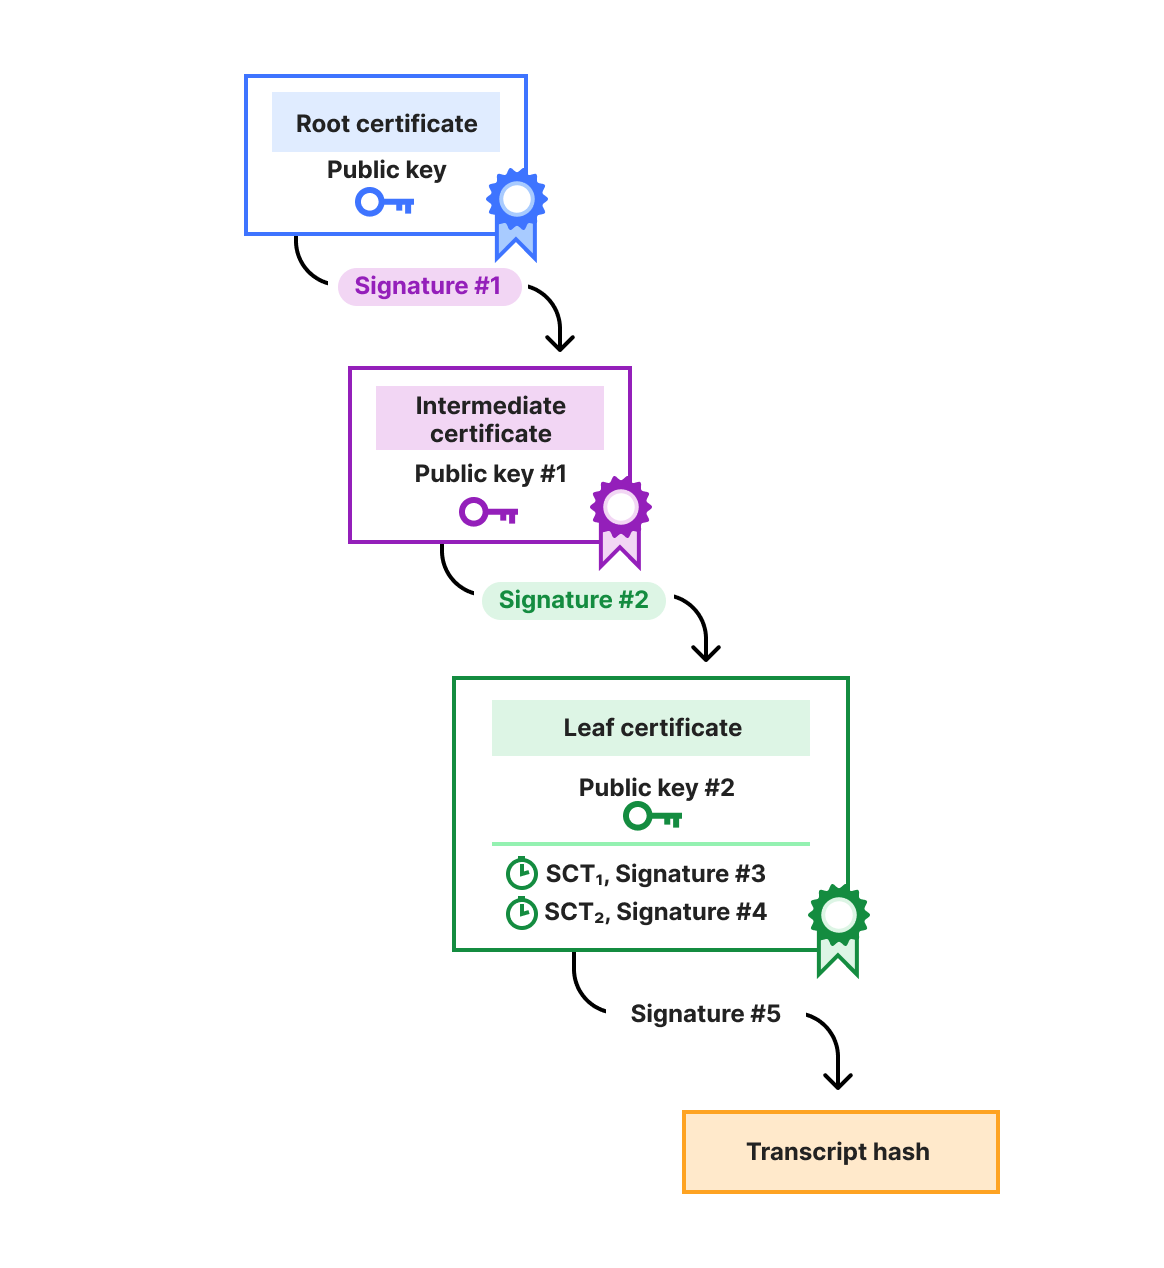
Like any secure infrastructure, we make sure that users authenticate to these privacy proxies before we open up a connection to the website they’re visiting. In order to do this in a privacy-preserving way (so that Cloudflare collects the least possible information about end-users) we use an open Internet standard – Privacy Pass – to issue tokens that authenticate to our proxy service.
Every time a user visits a website via our Privacy Proxy, we check the validity of the Privacy Pass token which is included in the Proxy-Authorization header in their request. Before we cryptographically validate a user’s token, we check if this token has already been spent. If the token is unspent, we let the user request through. Otherwise, it’s a “double-spend”. From an access control perspective, double-spends are indicative of a problem. From a privacy perspective, double-spends can reduce the anonymity set and privacy characteristics. From a performance perspective, our privacy proxies see millions of requests per second – and any time spent authenticating delays people from accessing sites – so the check needs to be fast. Let’s see how we reduced the latency of these double-spend checks from ~40 ms to <1 ms.
We use a tracing platform, Jaeger. It lets us see which paths our code took and how long functions took to run. When we looked into these traces, we saw latencies of ~ 40 ms. It was a good lead, but it alone was not enough to conclude it was an issue. The reason was we only sample a small percentage of our traces, so what we saw was not the whole picture. We needed to look at more data. We could’ve increased how many traces we sampled, but traces are large and heavy for our systems to process. Metrics are a lighter weight solution. We added metrics to get data on all double-spend checks.

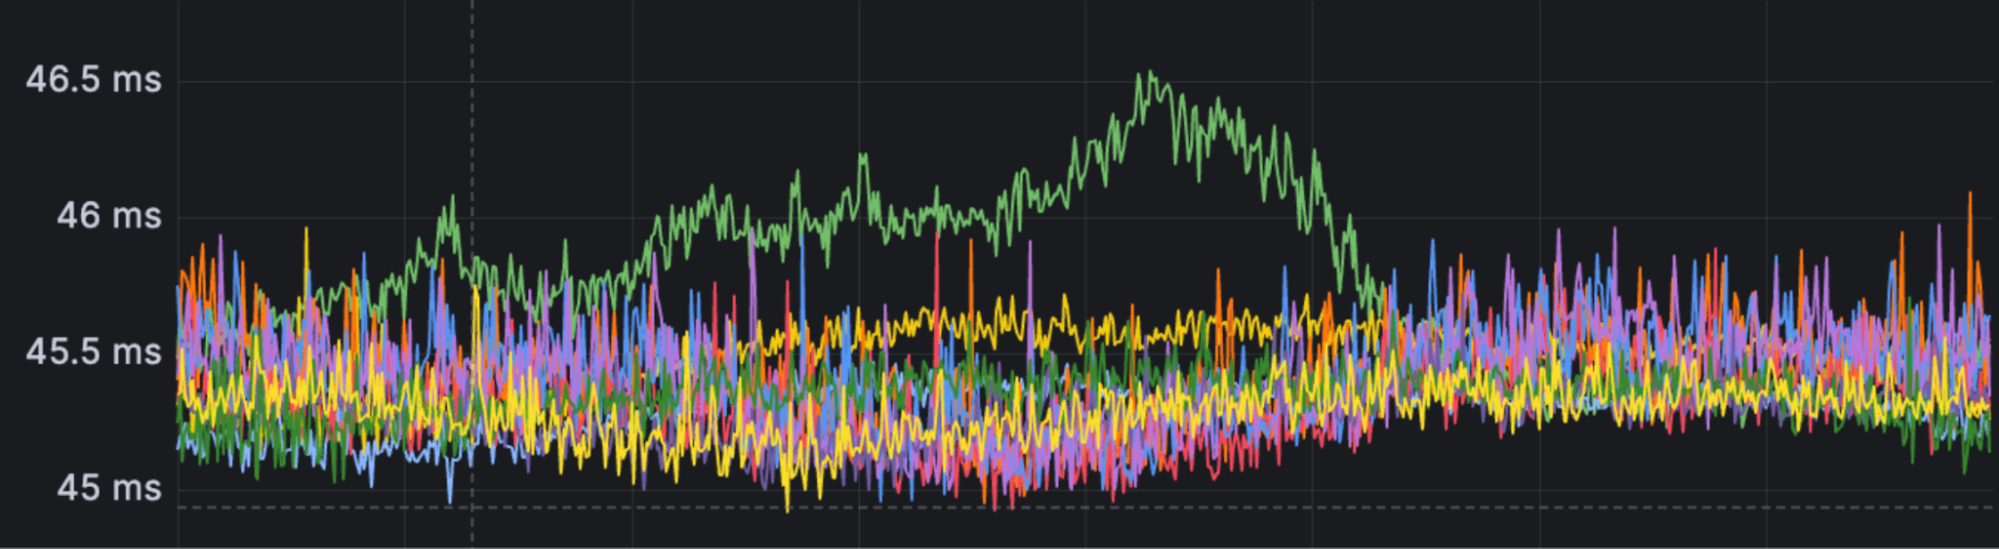
The lines in this graph are median latencies we saw for the slowest privacy proxies around the world. The metrics data gave us confidence that it was a problem affecting a large portion of requests… assuming that ~ 45 ms was longer than expected. But, was it expected? What numbers did we expect?
To understand what times are reasonable to expect, let’s go into detail on what makes up a “double-spend check”. When we do a double-spend check, we ask a backing data store if a Privacy Pass token exists. The data store we use is memcached. We have many memcached instances running on servers around the world, so which server do we ask? For this, we use mcrouter. Instead of figuring out which memcached server to ask, we give our request to mcrouter, and it will handle choosing a good memcached server to use. We looked at the median time it took for mcrouter to process our request. This graph shows the average latencies per server over time. There are spikes, but most of the time the latency is < 1 ms.

By this point, we were confident that double-spend check latencies were longer than expected everywhere, and we started looking for the root cause.
We took inspiration from the scientific method. We analyzed our code, created theories for why sections of code caused latency, and used data to reject those theories. For any remaining theories, we implemented fixes and tested if they worked.
Let’s look at the code. At a high level, the double-spend checking logic is:
-
Get a connection, which can be broken down into:
-
Send a
memcached versioncommand. This serves as a health check for whether the connection is still good to send data on. -
If the connection is still good, acquire it. Otherwise, establish a new connection.
-
-
Send a
memcached getcommand on the connection.
Let’s go through the theories we had for each step listed above.
We measured the health check primarily as a sanity check. The version command is simple and fast to process, so it should not take long. And we remained sane. The median latency was < 1 ms.

To understand why we may need to wait to get a connection, let’s go into more detail on how we get a connection. In our code, we use a connection pool. The pool is a set of ready-to-go connections to mcrouter. The benefit of having a pool is that we do not have to pay the overhead of establishing a connection every time we want to make a request. Pools have a size limit, though. Our limit was 20 per server, and this is where a potential problem lies. Imagine we have a server that processes 5,000 requests every second, and requests stay for 45 ms. We can use something called Little’s Law to estimate the average number of requests in our system: 5000 x 0.045 = 225. Due to our pool size limits, we can only have 20 connections at a time, so we can only process 20 requests at any point in time. That means 205 requests are just waiting! When we do a double-spend check, maybe we’re waiting ~ 40 ms to get a connection?
We looked at the metrics of many different servers. No matter what the requests per second was, the latency was consistently ~ 40 ms, disproving the theory. For example, this graph shows data from a server that saw a maximum of 20 requests per second. It shows a histogram over time, and the large majority of requests fall in the 40 – 50 ms bucket.

We decided to chat with Gemini, giving it the observations we had so far. It suggested many things, but the most interesting was to check if TCP_NODELAY was set. If we had set this option in our code, it would’ve disabled something called Nagle’s algorithm. Nagle’s algorithm itself was not a problem, but when enabled alongside another feature, delayed ACKs, latencies could creep in. To explain why, let’s go through an analogy.
Suppose we run a group chat app. Normally, people type a full thought and send it in one message. But, we have a friend who sends one word at a time: “Hi”. Send. “how”. Send. “are”. Send. “you”. Send. That’s a lot of notifications. Nagle’s algorithm aims to prevent this. Nagle says that if the friend wants to send one short message, that’s fine, but it only lets them do it once per turn. When they try to send more single words right after, Nagle will save the words in a draft message. Once the draft message hits a certain length, Nagle sends. But what if the draft message never hits that length? To manage this, delayed ACKs initiates a 40 ms timer whenever the friend sends a message. If the app gets no further input before the timer ends, the message is sent to the group.
I took a closer look at the code, both Cloudflare authored code and code from dependencies we rely on. We depended on the memcache-async crate for implementing the code that lets us send memcache commands. Here is the code for sending a memcached version command:
self.io.write_all(b"versionrn").await?;
self.io.flush().await?;
Nothing out of the ordinary. Then, we looked inside the get function.
let writer = self.io.get_mut();
writer.write_all(b"get ").await?;
writer.write_all(key.as_ref()).await?;
writer.write_all(b"rn").await?;
writer.flush().await?;
In our code, we set io as a TcpStream, meaning that each write_all call resulted in sending a message. With Nagle’s algorithm enabled, the data flow looked like this:

Oof. We tried to send all three small messages, but after we sent the “get “, the kernel put the token and rn in a buffer and started waiting. When mcrouter got the “get “, it could not do anything because it did not have the full command. So, it waited 40 ms. Then, it sent an ACK in response. We got the ACK, and sent the rest of the command in the buffer. mcrouter got the rest of the command, processed it, and returned a response telling us if the token exists. What would the data flow look like with Nagle’s algorithm disabled?

We would send all three small messages. mcrouter would have the full command, and return a response immediately. No waiting, whatsoever.
Our Linux servers have minimum bounds for the delay. Here is a snippet of Linux source code that defines those bounds.
#if HZ >= 100
#define TCP_DELACK_MIN	((unsigned)(HZ/25))	/* minimal time to delay before sending an ACK */
#define TCP_ATO_MIN	((unsigned)(HZ/25))
#else
#define TCP_DELACK_MIN	4U
#define TCP_ATO_MIN	4U
#endif
The comment tells us that TCP_DELACK_MIN is the minimum time delayed ACKs will wait before sending an ACK. We spent some time digging through Cloudflare’s custom kernel settings and found this:
CONFIG_HZ=1000CONFIG_HZ eventually propagates to HZ and results in a 40 ms delay. That’s where the number comes from!
We were sending three separate messages for a single command when we only needed to send one. We captured what a get command looked like in Wireshark to verify we were sending three separate messages. (We captured this locally on MacOS. Interestingly, we got an ACK for every message.)

The fix was to use BufWriter<TcpStream> so that write_all would buffer the small messages in a user-space memory buffer, and flush would send the entire memcached command in one message. The Wireshark capture looked much cleaner.

After deploying the fix to production, we saw the median double-spend check latency drop to expected values everywhere.

Our investigation followed a systematic, data-driven approach. We began by using observability tools to confirm the problem’s scale. From there, we formed testable hypotheses and used data to systematically disprove them. This process ultimately led us to a subtle interaction between Nagle’s algorithm and delayed ACKs, caused by how we made use of a third-party dependency.
Ultimately, our mission is to help build a better Internet. Every millisecond saved contributes to a faster and more seamless, private browsing experience for end users. We’re excited to have this rolled out and excited to continue to chase further performance improvements!